

Node diagrams serve as a type of data visualization that connects individual items (nodes) through lines or arcs (links). They depict the relationships among components in a system, capturing the complexity in a more digestible manner. This method helps users visualize connections and detect patterns or trends.
Nodes in a diagram can represent various data points, such as objects, entities, or people. The links between them then demonstrate the interaction or relationship between these nodes. Together, they form a whole that’s greater than the sum of its parts.
The use of node diagrams dates back to the Euler diagram invented by Swiss mathematician Leonhard Euler in the 18th century. Since then, node diagrams have evolved significantly and are now widely utilized across different fields.
An example is the social network analysis in which nodes represent individuals and links denote their interactions. Another one is project management, where node diagrams help to plan tasks and resource allocation.
Unraveling the Mystery: What is a Node Diagram?
A node diagram is a graphical representation of a network. It includes nodes or vertices, and links or edges that connect these nodes. As mentioned earlier, nodes can represent just about anything while links denote connections between nodes.
Node diagrams are composed of parallel, radial, or intersecting links between nodes depending on the relationships represented. The images can be color-coded or shaped differently to further differentiate nodes and links and make the representation more understandable.
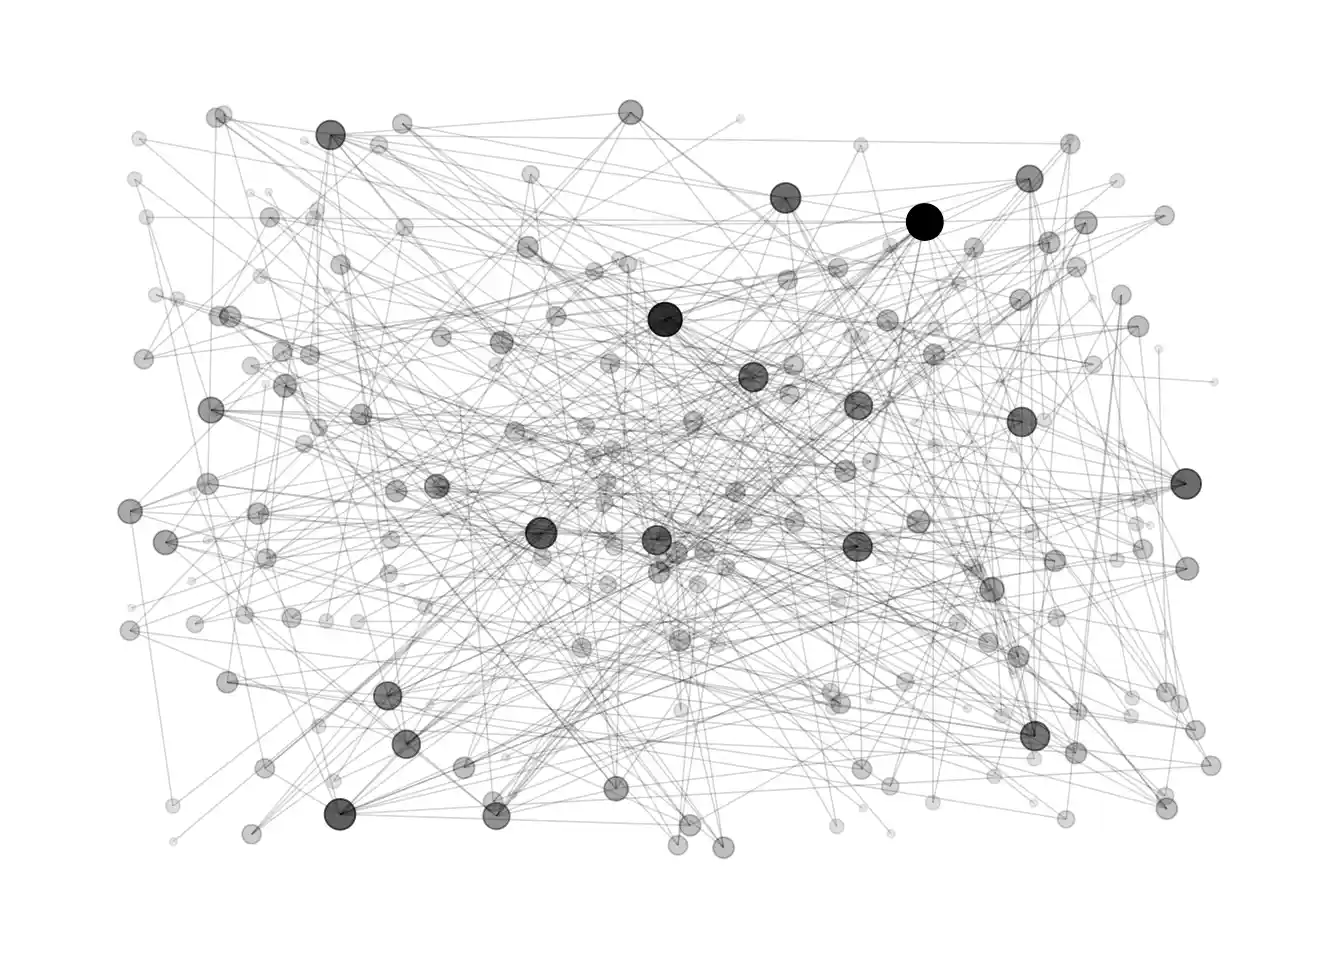
The individual node positioning plays a crucial role, as it directly influences the effectiveness of a node diagram. Ideally, nodes should be placed in a manner that minimizes the crossing of links, which aids interpretations.
Moreover, the size of nodes and links can also indicate properties like frequency or importance. Combined, those techniques enhance the comprehensibility of the diagram and foster better visual analytics.
Understanding the Role of Node Diagrams in Data Visualization
Data visualization offers a graphical approach to illustrating complex data. It plays a pivotal role in data analytics, showing patterns, correlations, and anomalies that may go unnoticed in numerically heavy statistics. Among such visualization tools, node diagrams stand out for their capacity to illustrate complex relationships.
Node diagrams are especially useful when dealing with multivariate data, where graphical representation assists in understanding interaction effects between different dataset variables. They are also widely employed to visualize networks and systems, including social networks, organizational charts, infrastructure blueprints, and even biochemical pathways.
Because node diagrams lay out both singular data points and relationships between them, they’re highly informative and versatile. They allow for simultaneous focus on the whole picture and the granular data points, which is often a challenge with more traditional types of data visualization.
Furthermore, the hierarchical structure of node diagrams facilitates breakdowns or drill down from the general overview to specific details. This interactive capacity enhances engagement with the data, facilitating a comprehensive understanding of the dataset.
Key Components of a Node Diagram
ALT: Interactive node diagram on a computer screen used for system analysis
Node diagrams consist of two primary elements: nodes and links. Nodes are the individual elements within the diagram, representing the unique data points. Depending on the context, nodes can represent anything from people in a social network to tasks in a project plan to cities in a transportation system.
Links, also referred to as edges or lines, connect nodes within the diagram. They depict relationships or interactions between nodes. For instance, in a project management diagram, a link might symbolize a dependency between tasks. In a social network, it might represent a friendship or communication channel.
Properties of nodes and links can further specify the data points. For example, the size of a node might represent the frequency of an event, or color-coding might illustrate classification or status. Similarly, the thickness of a link might indicate the strength or frequency of interaction, while the length can signify distance or duration.
Besides these core elements, node diagrams can harness more sophisticated visuals like labels, tooltips, or interactive features to enhance the diagram’s legibility and engagement. Collectively, those techniques enrich the analytical value of the diagrams and boost their interpretation capacity.
Altogether, node diagrams contribute greatly to the modern approach to data visualization and analytics. They are instrumental in simplifying complex data, illuminating patterns and relationships, and promoting informed, data-driven decisions. Hence, understanding and utilizing node diagrams is a useful skill in today’s data-rich world.